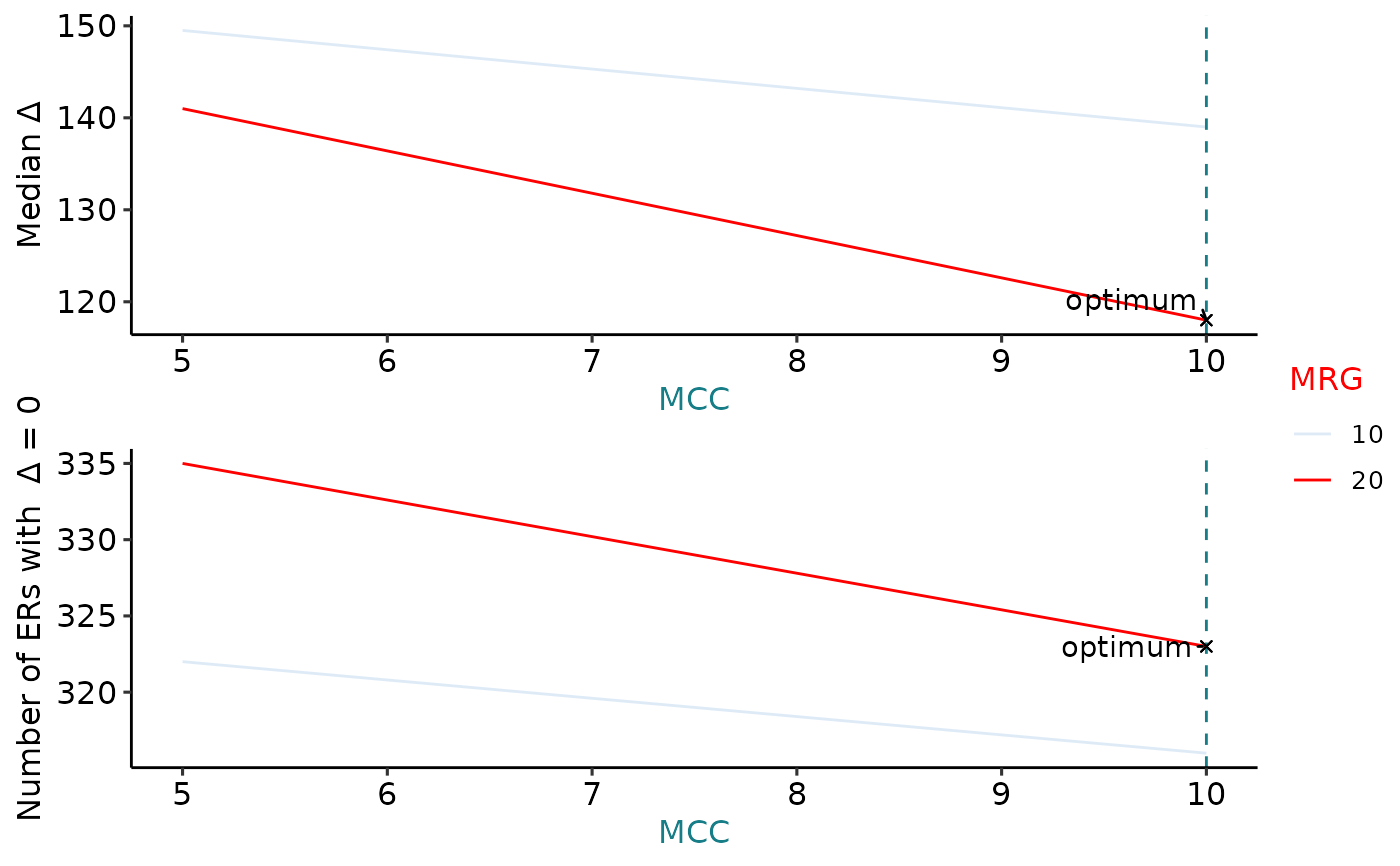
Plots the median deltas and the number of ERs with a delta of 0 against the MCCs on two separate graphs with a line for each of the various MRGs.
plot_ers(ers_delta, opt_mcc_mrg)Arguments
| ers_delta | tibble/dataframe containing summarised delta values. One row per set of ERs. |
|---|---|
| opt_mcc_mrg | vector containing the optimum mcc and mrg, in that order |
Value
Plot of MCC against median delta and number of ERS with a delta of 0